
As the House gets ready to consider voting on yet another extension of extraordinary “emergency” unemployment benefits, I thought it would be a useful exercise to take a look at the state of employment in the United States, particularly because today is “BLS Friday,” meaning that the Bureau of Labor Statistics just released its report regarding December 2013 job creation. The economy created just 74,000 jobs in December 2013, which is not enough to keep up with population growth (see below), and the unemployment rate dropped to 6.7%.
It’s ironic when the Administration speaks out of both sides of its mouth. On the one hand, Americans are suffering and we need another massive extension of unemployment benefits (we really don’t, actually). On the other hand, we are in the midst of a “rip-roaring recovery.” Can we really have it both ways? I doubt it.
Here are some things to consider when we try to determine what the “Real” unemployment is.
1. The labor force participation rate is at a 30-year low.
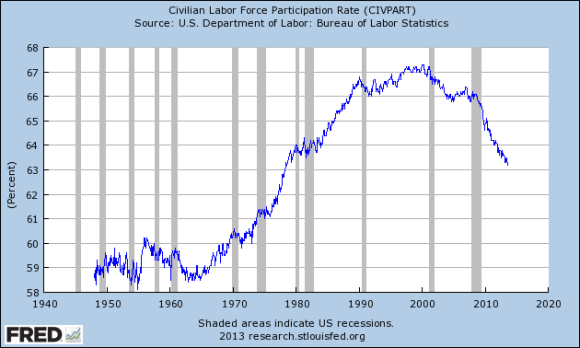
I touched on this point recently, but the labor force participation rate–meaning the percentage of adults of working age who are in the workforce, or looking for a job but are unemployed–is at a 30 year low. The labor force participation rate dropped from 65.7% in January 2009, when President Obama took office, to 62.8% in December 2013. Less adults working or looking for work is a depressing trend and it affects us in different ways, including having more folks applying for public assistance, unemployment benefits, or other types of welfare, as well as having less revenue come into the Treasury due to less people paying the Payroll Tax or Federal Income Tax.
Moreover, as some like the AEI’s Jim Pethokoukis point out on BLS Fridays, if the labor force participation rate was 65.7% today, there would be millions of additional workers who would now be considered “unemployed” by the BLS. This means a higher unemployment rate. It’s difficult to back test this method, but logically, if there are millions more workers who can’t find a job and dropped out of the labor force, the “real” unemployment rate is much higher than 7.0%. These workers are sometimes referred to as “discouraged workers” and are also somewhat tracked in the broader U-6 unemployment rate. More on this below.
2. There are over three-quarters of a million discouraged workers.
Without getting into a psychological debate, it strikes me as a problem when folks are discouraged from working because they cannot find a job and quit looking. The definition of a “discouraged worker,” according to the BLS, is a worker that thinks there are no jobs available to him or her. As of November 2013, 762,000 Americans consider themselves a “discouraged worker.” In December, there were 917,000 discouraged workers. This is a terrible trend. How does one motivate a discouraged worker to re-join the work force? It’s a depressing state of being that likely has effects on the individual, in addition to the problems that I outlined above (public assistance, decreased federal revenue, etc.).
This number has decreased over the last couple of months, and will decrease again when the BLS releases the household survey for December 2013. But another thing to note is that this number does not include seasonal employees. If you look at the data, there were over 1,000,000 discouraged workers in the summer of 2013, and well over 800,000 for the months leading up to November. Moreover, discouraged workers are not considered “unemployed” in terms of the BLS data and definitions. This is because in order to be considered to be “unemployed,” you have to (1) not have a job; (2) be looking for a job; and (3) be ready, willing, and able to work.
If all of those discouraged workers were considered “unemployed” by the BLS, the unemployment rate in November 2013 would be 7.5%. This “back of the napkin math” is based on the number of unemployed folks in November 2013 (10,907,000) plus the 762,000 discouraged workers, divided by the labor force (155,294,000).
Of course, you’ll never get all discouraged workers jobs. But the fact that there’s a half a percentage point difference in the unemployment rate if the BLS counted discouraged workers as unemployed tells you all you need to know about the situation. To paraphrase: there are lies, damn lies, statistics, and government statistics.
3. The broadest measure of unemployment, the so-called U-6, is pretty grim.
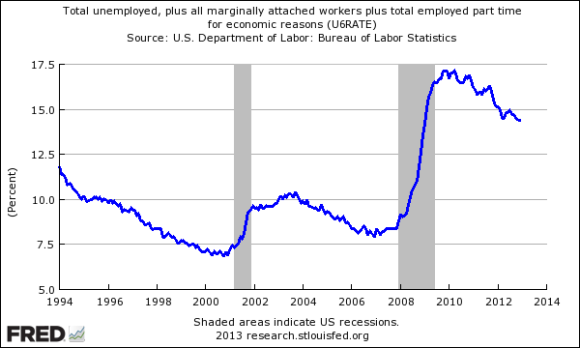
The broadest labor statistic that the BLS uses, the U-6, which measures unemployment as the “total unemployed, plus all marginally attached workers, plus total employed part time for economic reasons, as a percent of the civilian labor force plus all marginally attached workers” is much higher than the reported 7.0%. Some of the state-by-state data is eye-opening:
The “Real” Unemployment Rate
13.5% in Arkansas;
12.9% in Colorado;
15.3% in Georgia;
9.3% in Iowa;
14.6% in Kentucky;
12.6% in Louisiana;
15.8% in Michigan;
14.9% in North Carolina;
16.5% in Oregon;
11.6% in Virginia.
These are all up from 2009, despite the recession having ended in June of that year.
What’s wrong with this picture?
One of the major problems is excessive government regulation.
I wrote about this on a couple of occasions recently. When it costs $10,000 for a small business to hire somebody–just in terms of the regulatory cost–that begins to become cost-prohibitive. Add in the massive regulatory nightmare that is Obamacare (the regulatory effects of which we have only begun to feel) and we have some major problems.
It strikes me as a major burden on job creators to have a big regulatory bureaucracy that costs up to $216 billion a year and takes that out of the economy instead of leaving that capital in the hands of job creators, business owners, and employees.
Another factor to consider is that the labor force continues to grow every month. Estimates are that America needs over 100,000 (give or take) jobs just to keep up with population growth. So while creating 200,000 jobs or so in a month is certainly better than creating zero jobs, the “real” amount of job growth is less than the 200,000 number that we might here. If we expect to recover the jobs lost during the Great Recession, more jobs need to be created. How do we do this? Not by government fiat–but by letting the private sector respond to demand.
Instead of over-regulation (and over taxation), government needs to get out of the way of business and let the market work. Owning a small business in America should not be cost prohibitive.
The best jobs bill would be a repeal of Obamacare and most other burdensome government regulation.
As always, free markets are better markets.